Meet the 2021 PEP Students!

Christabelle Agyapong
Morgan State University
Senior, Biology/Chemistry
PEP Mentor: Carolyn Tepolt, Woods Hole Oceanographic Institution
Presentation Title: Green Crab Takeover: Analysis of Ongoing Range Expansion through Genomics
Abstract: Carcinus maenas or European green crabs originate from the coasts of Northern Africa to Norway and Iceland. European greens crabs are an invasive species that have invaded the Northwest Pacific Region in rocky intertidal and estuarine areas. The green crabs are a great concern because they have the ability to perturb native marine ecosystems and predate aquaculture species. The recent green crab expansion into the Salish Sea has been troubling to locals because they are increasing. There is a need to understand where these crabs are coming from to help manage these species. Sooke Basin is located in the Salish Sea and contains a green crab population that has a distinct genetic signature. Thus, our project sought to understand how the genetic makeup plays a role in their expansion throughout the Salish Sea area. We used 5,657 Single Nucleotide Polymorphisms (SNPs) to explore population structure in 190 samples collected by the Washington Sea Grant Crab Team from Oregon to British Columbia, Canada. These are the genetics of many of the very first crabs to expand into these areas. These genetic markers were used in Principal Components Analysis (implemented in smartPCA and the adegenet R package) to analyze population structures that told us how the crabs came from the Salish Sea and how they are related. We found that the samples fell into three main groups. Our first group showed that crabs from Oregon, Washington, and parts of Canada were similar. The third group consisted primarily of the Sooke population, along with individual crabs from islands and eastern areas within the Salish Sea. The second group contained “hybrids” which are crabs that have one parent from both groups. This grouping has strong statistical significance and suggests that crabs in the Salish Sea crabs are dispersing from outside the Salish Sea and Sooke. This dispersal is likely due to the crab larvae moving freely through the currents and settling in places that they do not originate. The Sooke population on the other hand, is a very isolated population that does not appear to receive larvae from other areas, though we do find larvae from Sooke dispersing widely to other sites. Our data can allow for better and careful management of the green crabs population and help policy makers make policies to prevent further spread and protect vulnerable ecosystems and economically important aquaculture.

Hannah Brunelle
Wheaton College
Junior, Environmental Science
PEP Mentor: Hauke Kite-Powell, Woods Hole Oceanographic Institution
Presentation Title: Modeling Real Estate Value in the Proximity of Duxbury Bay
Abstract: Duxbury Bay is located on the coast of Massachusetts, with the surrounding towns of Duxbury, Kingston and Plymouth. This body of water supports many different ecosystem services and economic values, including waterfront properties, commercial oystering, and fishing and recreational activities. This research replicates an earlier study done by the Woods Hole Oceanographic Marine Policy Center. The purpose of this research is to examine the property values of real estate in the town of Duxbury and to investigate how they may change with sea level rise. Waterfront properties normally exhibit high market values, however changing coastlines due to sea level rising and erosion put these properties at risk of being lost or damaged. Latitude/longitude information for 3500+ properties were obtained from the Warren Real Estate Group and plotted in the QGIS mapping software to determine how far each property is from shore. Once this distance was determined, Microsoft Excel software was used to estimate and analyze the data, and create a linear regression model for property value. The variables within the analysis are the assessed total price, lot size, house size and the distance from the coastline. Through the regression analysis, total prices were assessed to ultimately determine if the effect of a property's distance from the shoreline had a positive or negative relationship on the assessed total price.
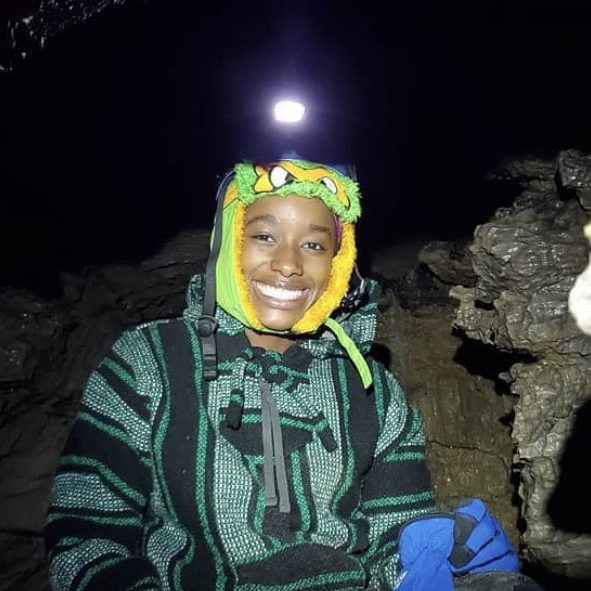
Lyric Carter
Tennessee State University
Senior, Environmental Science
PEP Mentor: Jennifer Watts, Woodwell Climate Research Center
Presentation Title: Legacy effect of fire disturbance on Soil Respiration in Permafrost
Abstract: Permafrost soils, those remaining frozen for two or more years, in Arctic tundra and boreal regions hold vast stores of carbon. This is more carbon than is currently in Earth’s atmosphere. Due to rising temperatures, most of these ‘icy soils’ are becoming less permanent as our climate change problems wane on. “Permafrost” soils are thawing rapidly as the Arctic warms and soil layers above permafrost are freezing for shorter periods each year. The loss of carbon from these soils as greenhouse gases, including carbon dioxide (CO2), is a global threat and may further amplify warming. Another threat comes from hotter and drier summers across the Arctic region, and increased fire disturbances which may inevitably expedite the soil’s thaw and release of CO2. The project investigates the primary environmental impacts produced by soil CO2 emissions from permafrost affected tundra and boreal landscapes in Alaska. We also examine the legacy effects of fire disturbance on soil CO2 loss in the Alaskan tundra and boreal forest. Eleven soil respiration monitoring sites were installed, six being boreal sites and five being tundra sites. In addition to measuring hourly CO2 efflux, we also continuously measured soil temperature and soil moisture. With this information, we investigate burn sites and how environmental drivers play a major role in increasing CO2 flux in these areas.

Hector Delgadillo
California State University, Long Beach
Senior, Marine Biology
PEP Mentor: Jennifer Watts, Woodwell Climate Research Center
Presentation Title: Investigating the biotic and abiotic controls on soil CO2 emissions from an Alaskan boreal forest
Abstract: The earth is warming at a rate higher than previously recorded. This warming is disproportionately affecting higher latitudes, with arctic and boreal habitats recently experiencing 0.4 °C increases per decade. These regions store very large amounts of organic carbon in permafrost (continuously frozen soils) and seasonally frozen near-surface soils (i.e., the active layer). As these soils thaw and warm, they can release carbon dioxide (CO2) to the atmosphere. A pressing question is how climate warming will affect soil carbon fluxes in these forest habitats. An increase in annual growing season length may help to sequester more carbon through increased primary production. Contrastingly, prolonged warming may continue to increase soil temperatures and expose more permafrost to thaw and decomposition, resulting in higher CO2 emissions. Additionally, it is unknown whether increases in nutrient availability, specifically nitrogen, will influence carbon fluxes. This research analyzes a transect of 21 sites in coniferous and deciduous forest stands within the NEON Caribou-Poker Creek research site in Interior Alaska. Soil CO2 fluxes and the biotic and abiotic variables that influence flux were examined over the spring through mid-summer (May – July) period in 2021. Through statistical analyses, we found that carbon fluxes were significantly higher in deciduous communities. Soil temperatures increased as the season progressed, leading to higher CO2 loss. Generally, lower surface moisture levels were highly correlated with higher CO2 loss. However, soil temperature, moisture, and thaw depth were not statistically different between the two forest stands, suggesting additional drivers of CO2 loss. To examine the influence of nitrogen on CO2 loss within the two stands, we employed the Stoichiometrically Coupled, Acclimating Microbe-Plant-Soil model (SCAMPS). These results will help us better understand how ecosystem properties can influence CO2 loss in warming boreal habitats, possibly by 8°C at the end of the century.
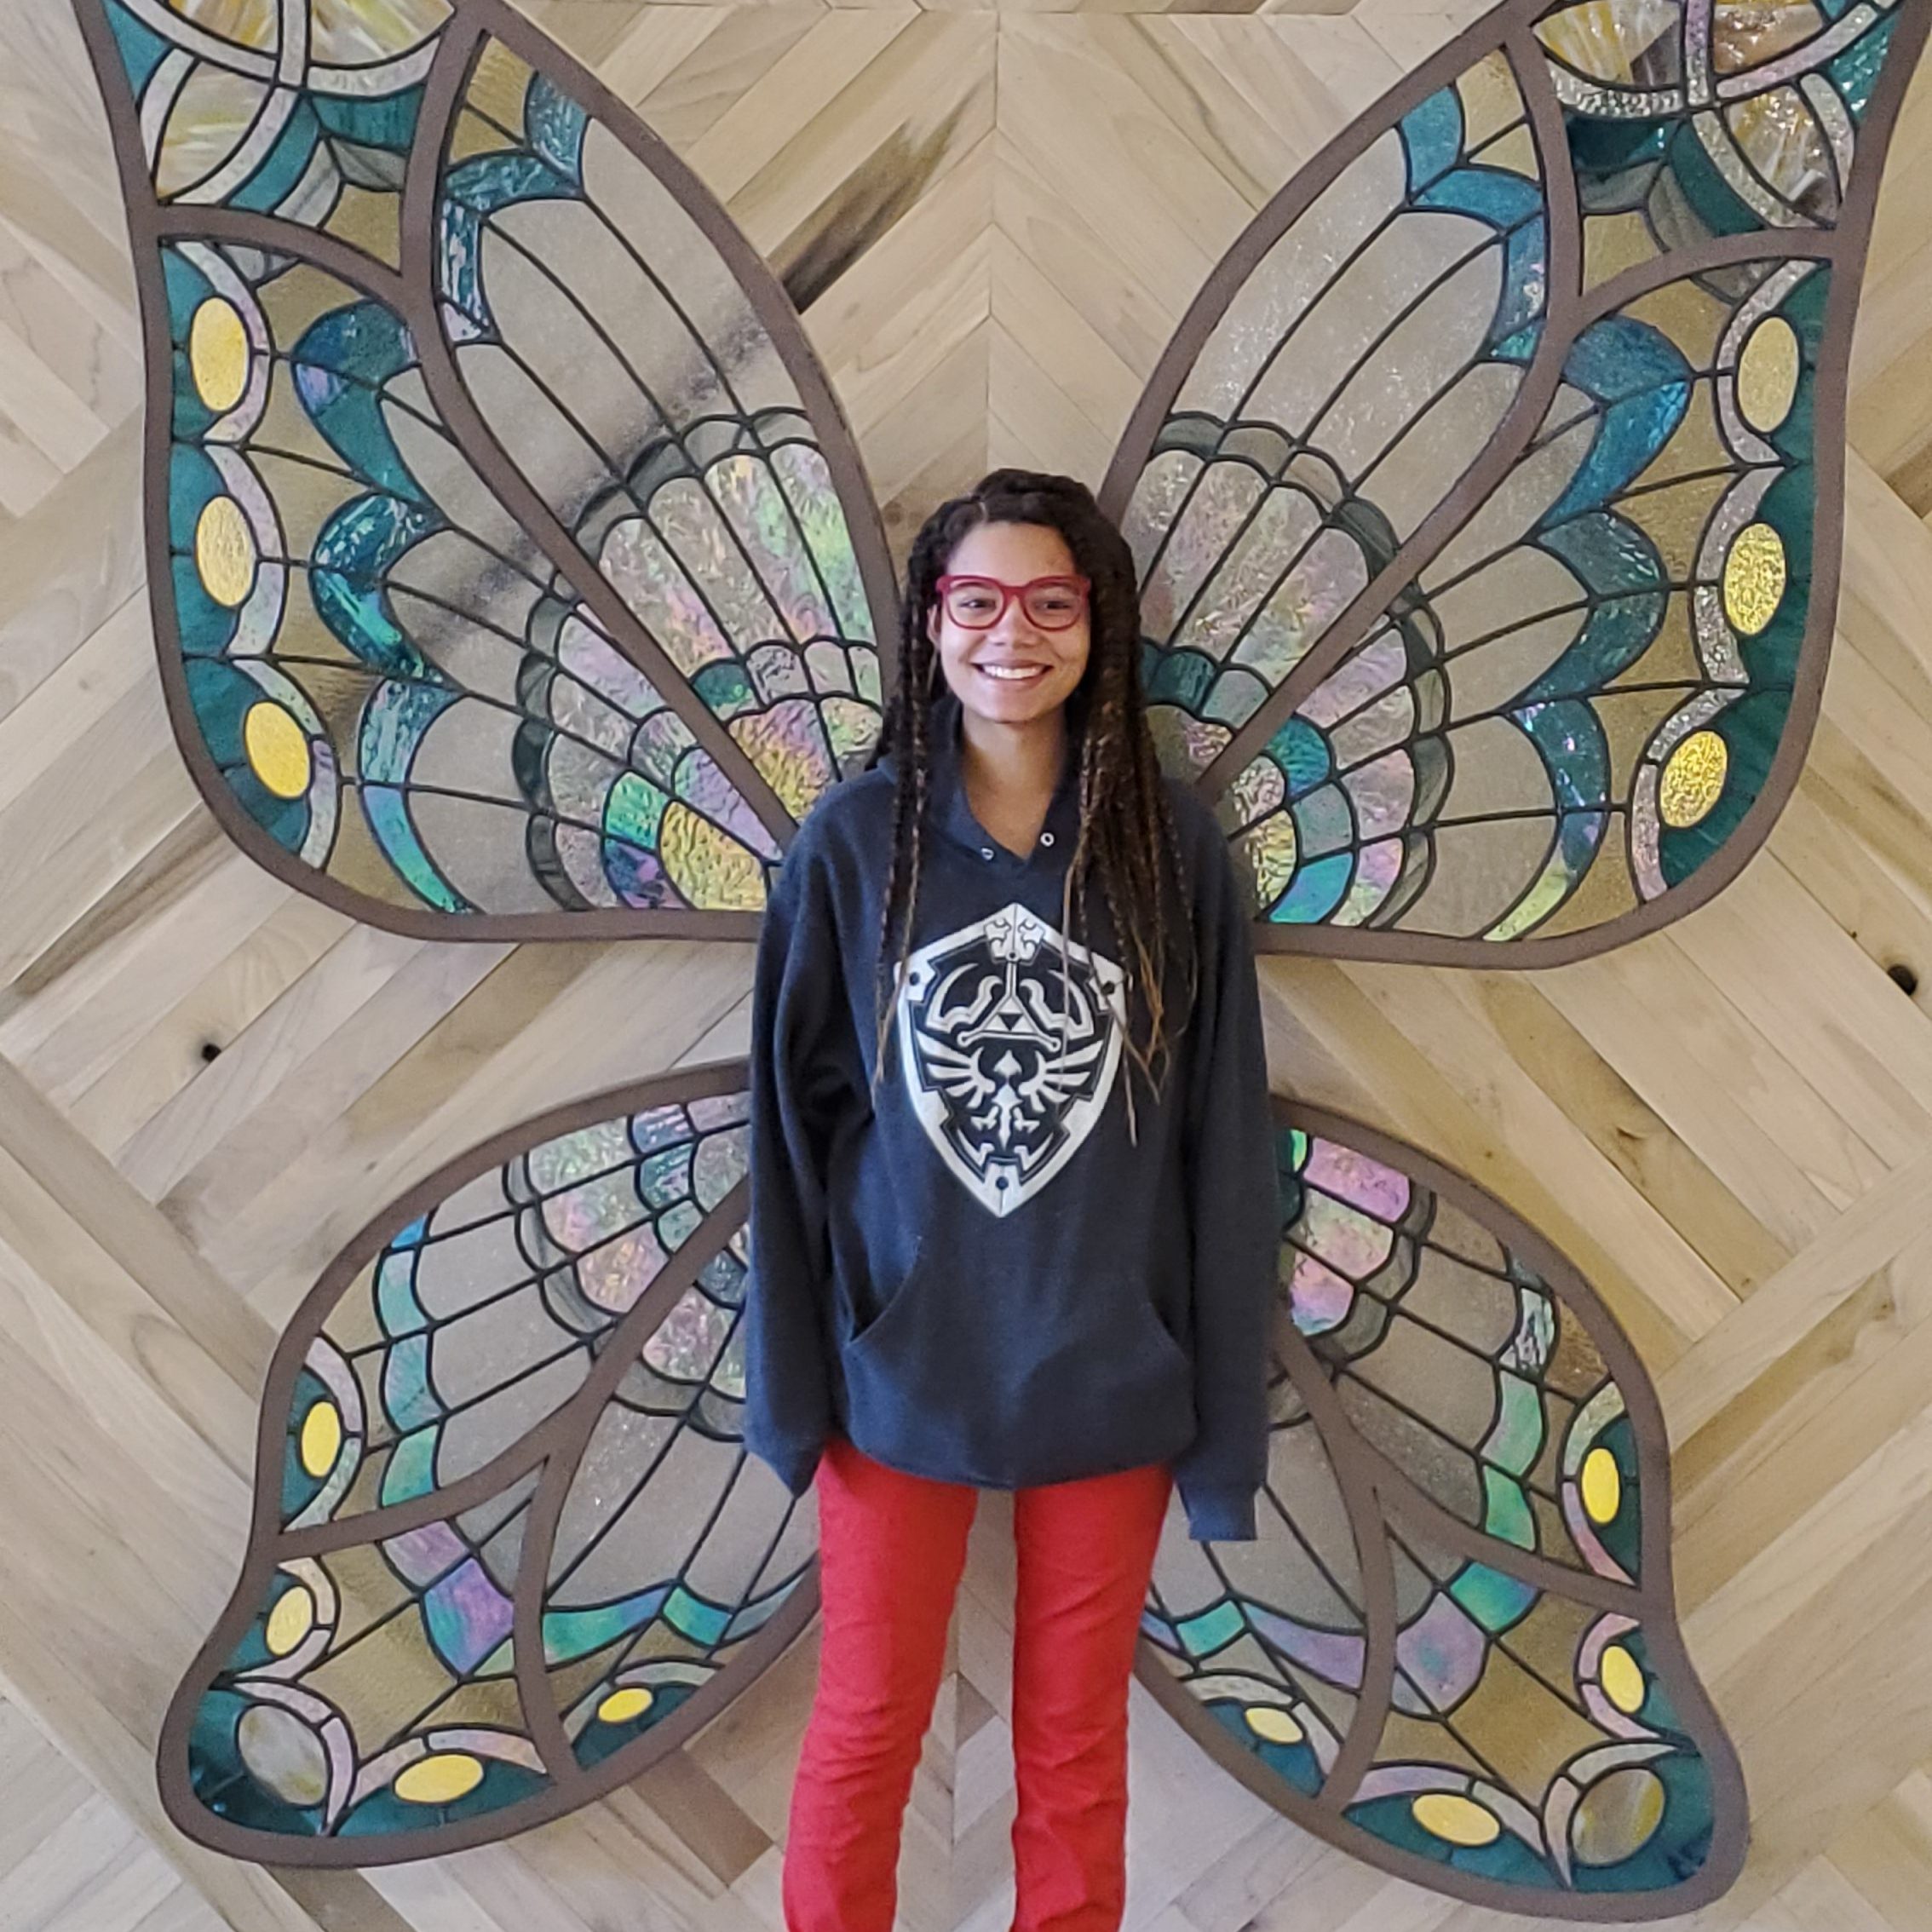
Xzayana Henderson
Dakota State University
Junior, Biology
PEP Mentor: Samuel Laney, Woods Hole Oceanographic Institution
Presentation Title: Wintertime Arctic Phytoplankton: An Overview
Abstract: Information about phytoplankton distribution in the Arctic in the winter has very low observations. Phytoplankton abundances were measured using imaging microscopy in the Chukchi Sea in early winter 2011. Samples were taken from multiple sections from nearshore to offshore crossing different water masses. This analysis concentrated on six key, easy to distinguish taxa, Ceratiun, Chaetoceros, Cylindrotheca, Dinophysis, Thalassionema, and Thalassiosira, using Imaging FlowCytobot. This type of imaging microscopy allows us to generate images of the phytoplankton while still in the natural aquatic environment. Based on incubated samples focusing on Chaetoceros and Thalassionema an anomaly was indicated as the Talassionema seemed to do worst in the light. This could have been due to the computer counting an image as one organism and not the individuals.
Phytoplankton taxa have different over winter strategies that are poorly understood. While this research is only the beginning of finding these answers, a relatively brief analysis did reveal collective data. This data was also computed by hand and human error should be taken into consideration. There is a visual change in surface phytoplankton from the inshore to the offshore samples with the most extreme difference is shown in the Wainwright Line samples. These samples seem to have no pattern of change. The Point Lay samples show a distinct difference that could be due to the different oceans merging in this one spot. This study provides differences in this complex region that many do not venture to in the winter months, and insight to over winter states of the different algae and how they respond to light.

Miles Jordan
Florida Agricultural and Mechanical University
Junior, Marine Biology
PEP Mentor: Meagan Eagle, United States Geological Survey
Presentation Title: Trace Element Cycling within the Sage Lot Pond Subterranean Estuary
Abstract: Submarine groundwater discharge (SGD) is an important source of trace metals to the ocean, with the chemistry of SGD set during transit through subterranean estuaries (STE), mixing zones between fresh and salty water analogous to the region where a river meets the ocean. The STE in the fringing salt marsh at Sage Lot Pond, MA, USA, contains peat on top of sand. At this site, estuary water infiltrates and flows through the peat, with reducing conditions, and mixes with fresh groundwater in the underlying sand STE. Porewater samples were collected at multiple depths (9-245 cm) across the marsh platform seasonally from 2014-2019. Iron (Fe), manganese (Mn), barium (Ba), and uranium (U) concentrations were determined in porewater in contact with the peat and sand, as well as upland groundwater. Ba salinity mixing plots indicate significant desorption, particularly in the sandy STE, with concentrations peaking at >200 nM. Mn is highly enriched within the STE, with the highest concentrations in the peat and a region of Mn release at the sand-peat interface. Fe is enriched in the fresh groundwater, and then largely removed throughout the peat and sand STE, however there is some Fe release at the sand-peat interface. U removal is apparent throughout the STE. End member trace metal concentrations were paired with water fluxes for three regions of the STE averaged 73 L/m2/d: (1) shallow (21%) and (2) deep (72%) peat-contact porewater exchange (PEX) and (3) SGD (8%) flowing through the sand. All Fe (313 uM/m2/y) fluxes were within SGD. Deep and Shallow PEX were the main contributors to Mn (365 uM/m2/y) and Ba (1700 uM/m2/y) fluxes and U (-878 uM/m2/y) removal. In conclusion, given the global extend of salt marsh ecosystems, geochemical cycling within these STEs may be important to consider in global trace element budgets.

Jabari Lottie
Morehouse College
Junior, Biology
PEP Mentor:Jennifer Wallace-Turek, National Oceanic and Atmospheric Administration
Presentation Title: Creating visualizations of sounds data collected by NOAA Passive Acoustics Group
Abstract: For millions of years marine organisms have used sound to communicate and access their environment. These sounds can help maintain social structures, protect from predators, encourage breeding, and surely serve other purposes yet to be discovered. After the industrial revolution anthropogenic sounds have had an increased effect on marine ecosystems and their organisms due to global shipping, construction activity, naval training, and more; all contribute to ocean noise and potentially affect marine organisms and their ecosystems.
Recording of marine acoustics has been done worldwide to assist with learning the role that sound takes within these marine environments. Utilizing acoustics collected by NOAA Passive Acoustics Group and other collaborators we have begun creating spectrograms of iconic examples for many sounds both anthropogenic and natural marine. With these sounds we have begun updating the publicly available web-based acoustic database of biological, anthropogenic, and environmental sounds from the ocean. With continued updates to sounds, visuals, and of website aesthetics we further improve the accessibility of this data and potentially aid in future research.

Xavier Manning
Howard University
Sophomore, Environmental Science
PEP Mentor: Christopher Neil, Woodwell Climate Research Center
Presentation Title: The Coonamessett River: Hydrology and Chemistry
Abstract: Nitrogen loading, caused by an overabundance of nitrogen in runoff and other forms of pollutants, can result in the formation of toxic algal blooms, deoxygenation, biological dead zones, and damage the overall health and quality of the water. The Coonamessett River, a narrow river in Falmouth, Massachusetts, is one of many rivers that is at risk of succumbing to the consequences of nitrogen loading. Surrounded by urban infrastructure and cranberry bogs, the Coonamessett is highly susceptible to nitrogen loading from agricultural and septic tank runoff. Over the course of a two-and-a-half-year span, concentrations of NH4+, NO3-, dissolved organic nitrogen (DON), and particulate organic nitrogen (PON) were measured along the river at twelve different stations. In addition to these measurements, we also collected hourly discharge velocity data and acquired precipitation data from the Department of Conservation and Recreation of Massachusetts. With this information, it was found that a significant majority (74%) of nitrogen that leaves the mouth of the river into the coastal estuary arrives in the form of nitrate, which is predominantly found in waste. With large increases of nitrate concentration occurring alongside local Falmouth housing, we concluded that the main contributors to the nitrogen pollution that was transpiring in the Coonamessett were the septic tanks of nearby houses.

Jessica McLaughlin
University of Rhode Island
Junior, Ocean Engineering
PEP Mentor: Anna Michel, Woods Hole Oceanographic Institution
Presentation Title: The Sipper: A Water Sampling System
Abstract: Acquiring multiple water samples in harsh or remote environments can be a tedious and difficult feat. With the advancements of underwater vehicles, researchers have furthered their understanding of these locations. Through the development of the “Sipper” system, small robotic platforms will be able to autonomously capture water samples. In order to rapidly-prototype the Sipper, individual components were first modeled in SolidWorks. This enabled the visualization of the design that included an intake filter to prevent clogging, a pump to maintain water flow into the system, push-connect fittings to create a manifold, and five solenoid valves. The manifold routes water into five different channels where the in-line solenoids control which unit the water flows into at different times. An Arduino Uno is used to control all of the components and programming the sampling interval. The Sipper pumps five individual water samples into half-liter IV bags. Testing was completed without a robotic platform, however, in the future by packaging the Sipper it will be deployable on small field vehicles. With a fill time under 30 seconds for each bag, this cost-effective system could be adapted for a range of mission objectives based on a location’s chemistry, biology, or anthropogenic pollutants. Rapidly-prototyped systems, like the Sipper, are very adaptable as other sampling containers or in-line filters can be changed to meet the scientific objective. Along with changing the overall design, the Arduino can be programmed to sample based on water depth. In future iterations, samples could be triggered via remote operation, ideal for sampling water in unanticipated areas of interest. As much of the planet’s oceans remain a mystery, deploying a system for the analysis of water properties at various times and depths will help ocean researchers develop a better understanding of remote underwater environments.

Maya McWilliams
Jackson State University
Junior, Biology
PEP Mentor: Matt Charette, Woods Hole Oceanographic Institution
Presentation Title: Analysis of Radium 223 and 224 Isotopes from the Pacific Ocean in 2018
Abstract:

Jonathan Nash
Hampton University
Sophomore, Marine Biology/Environmental Sciences
PEP Mentor: Heidi Sosik, Woods Hole Oceanographic Institution
Presentation Title: Quantifying the distribution of gelatinous invertebrates and their habitat conditions on the Northeast US Shelf through imagery and associated environmental data
Abstract: Gelatinous zooplankton (specifically ctenophores and medusae) are key predators within the environment. In large numbers they can cause catastrophic damage to the health of their ecosystem due to the increased predation of zooplankton and larval fish. However, it is very difficult to assess the distribution of these fragile animals using traditional means. We are using images taken with an In Situ Ichthyoplankton Imaging System (ISIIS), a specialized underwater camera that is towed by a research vessel, taking images at fifteen frames per second and giving us more data than ever before to examine the distribution of fragile zooplankton. We used multiple tows from a cruise on the R/V Endeavor in October 2020 along the NES-LTER (North East U.S. Shelf - Long Term Ecological Research) transect, which stretches more than 100 miles from Martha’s Vineyard to the edge of the continental shelf. Each tow was specifically selected so that there was a sufficient amount of images to picture the distribution near-shore, mid-shelf, and off-shore. Our goal was to see the distribution of gelatinous zooplankton near-shore, mid-shelf, and off-shore past the shelf break. We identified medusae, ctenophores, and chaetognaths in a subset of the tows, annotating 170,000 images to create a training set for a machine learning algorithm to be used for automated classification of entire tows. Our data indicated ctenophores and medusae were more abundant near-shore while chaetognaths were more abundant closer to mid-shelf. In addition to the results for distribution of gelatinous zooplankton on this cruise, the workflow can be applied to ISIIS tows conducted on other transect cruises for the NES Long-Term Ecological Research (LTER) project.

Derrick Richardson
Hampton University
Sophomore, Marine and Environmental Sciences
PEP Mentor: Julie Huber, Woods Hole Oceanographic Institution
Presentation Title: Genomic annotation of an extremophilic, alkaliphilic methanogen
Abstract: Methanocalculus natronophilus strain Z-7205 was isolated from soda lake Tanatar II located in Altai, Russia. This extremophilic methanogenic archaeon is an obligate alkaphile, growing up to pH of 10.2, and is dependent on carbonates for growth. It belongs to a newly proposed family Methanocalculaceae. We have annotated the genome of M. natronophilus to determine its functional gene repertoire, metabolic pathways and processes, and evolutionary relationships. The genome functional annotation was performed on the Department of Energy Systems Biology Knowledgebase (KBase). The quality control of raw sequence data was generated by FastQC. We used the programs Megahit, IDBA, and SPAdes to assemble the genome, and to evaluate the assemblies, we compared them using QUAST. SPAdes provided the best assembly, with 179 total contigs, the largest being 403,126 bp. The N50 value was 273,644 bp, the total assembly length was 2,028,191 bp, and the G+C content was 51.3%. The genome was annotated using RASTtk, Prokka and DRAM. The annotations predicted 2,300 protein-coding genes, 2 complete rRNA, and 45 tRNA. M. natronophilus has genes for the complete pathway for generating methane from H2 + CO2 as well as formate. An incomplete nitrogen fixation pathway was also found. VirSorter analysis found viral proteins but did not find any evidence of prophages. Using Species Tree Builder, we made a phylogenetic tree of the closest related species to M. natronophilus. From the publicly available genomes, Methanocalculus alkaliphilus strain AMF2, and Methanocalculus natronophilus strain AMF5 are the closest relatives by evolutionary ancestry, supporting the new family designation for this group. We used OrthoMCL to do a pangenome comparison between M. natronophilus and Methanococcus maripaludis, a well-characterized methanogen. The pangenome comparison found 8 core functions and 830 core families amongst the two organisms. Together, these results provide new insights into evolutionary relationships and metabolic pathways for this extremophilic group of methanogens.

Mya Rufus
University of Maryland Eastern Shore
Senior, Environmental Science
PEP Mentor: Elizabeth Pendleton, United States Geological Survey
Presentation Title: Data Accuracy Assessment of the Coastal Change Likelihood in the Massachusetts
Abstract: An accuracy assessment is an important step in any data interpretation. The USGS Coastal Change Likelihood project is using an accuracy assessment to determine the quality of some of the source landcover information used in the project. Northern Massachusetts was selected as the focus area of this accuracy assessment and GIS mapping software was used to conduct the assessment on two datasets: NOAA’s Coastal Analysis Program (C-CAP) Landcover Atlas and NOAA’s Environmental Sensitivity Index (ESI) dataset. Two hundred equalized, stratified, random points were created within the study area and the landcover classification in C-CAP and ESI, created through machine learning and digitization, respectively, was compared to a user’s interpretation of the landcover in the 2016 National Agricultural Imagery Program (NAIP) aerial photographs. After all 200 points were ground truthed by the user, a confusion matrix was generated to compare the landcover identified in the source data to the landcover identified by the user. Results from the confusion matrix indicate that the total accuracy of the C-CAP and ESI datasets is about 60%, and the Kappa coefficient is 0.54, which indicates that these source data are only in moderate agreement with user landcover interpretation. Possible reasons for lower than expected accuracy may be related to how a user observes the broader landscape vs how the computer sees individual pixels. Moreover, some areas were difficult to differentiate between other classes visually, and using other imagery, such as false-color, may help aid the user's interpretation. In summary, based on initial accuracy results ,CCAP and ESI data should be used with caution when basing further analysis on the landcover interpretation.
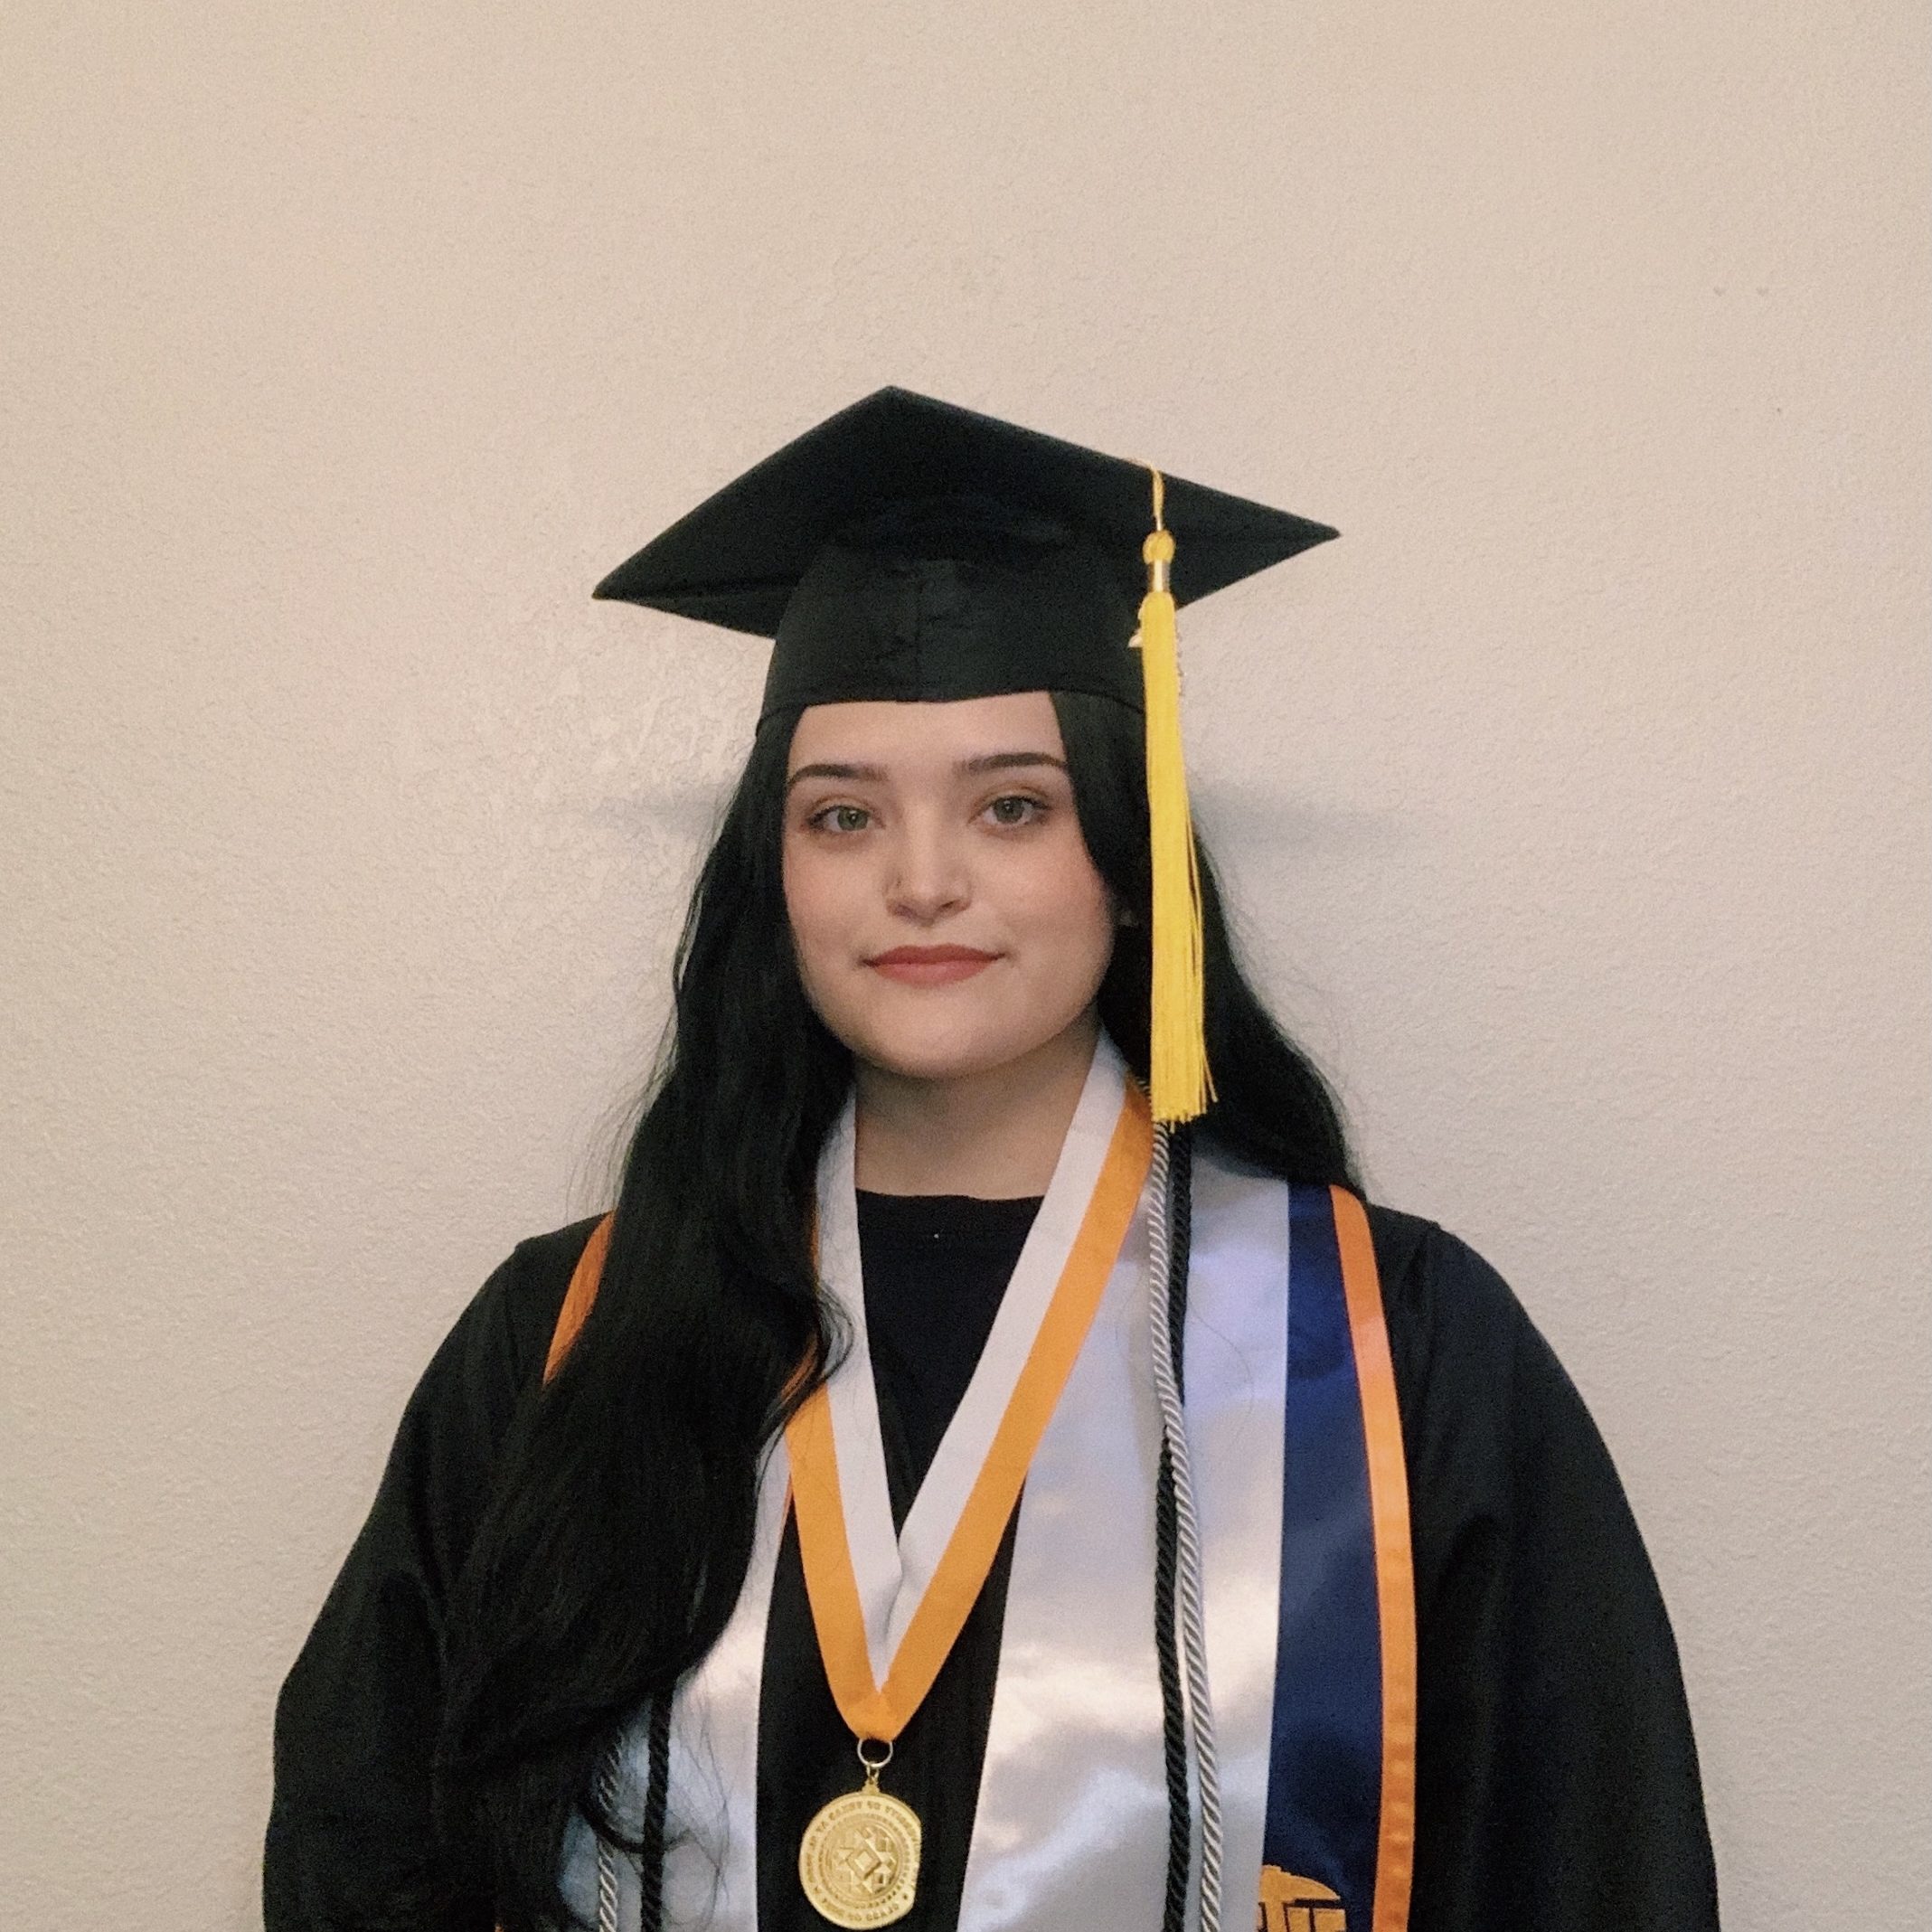
Rhegan Thomason
University of Texas, El Paso
Senior, Biology
PEP Mentors: Scott Large, Kimberly Bastille, and Kimberly Hyde, National Oceanic and Atmospheric Administration
Presentation Title: Estuarine Data Workflow for Ecosystem-Based Fisheries Management
Abstract: The State of the Ecosystem Report (SOE) provides ecosystem context for management objectives for the Mid-Atlantic and New England regions. The New England Fisheries Management Council requested more information on estuarine habitats for this report. Estuaries are essential habitats for fish and referred to as “nurseries of the sea” because they provide habitat and breeding grounds for multiple marine species important to fisheries-reliant communities. The primary objective is to develop a reproducible data workflow using open data science tools and principles that will be used to provide estuarine habitat information into annual SOE reports. Inclusion of this data provides more information on essential fish habitat that is needed to inform ecosystem-based fisheries management. We used data from the National Estuarine Research Reserve System (NERRS) to explore water quality and climate indicators at four sites in the New England region. NERRS conducts research and monitors the ecosystems to “track short-term variability and long-term changes due to natural and anthropogenic disturbances”. We acquired and compiled data from the NERRS Centralized Data Management Office to create a partially automated workflow that analyzes and visualizes available data. We developed open access code to generate time series and climatologies for temperature, dissolved oxygen, salinity, and chlorophyll. This project uses RStudio with GitHub integration to version control data and code as well as enhance collaboration and transparency. This workflow was designed to be reproducible and available for future use anywhere the data is applicable. This project is in coordination with the Ecosystem Dynamics and Assessment branch of the Northeast Fisheries Science Center and aligns with their mission to “integrate biological, climate, oceanographic information, along with human-related activities to gauge the effects on ecosystem structure and function”.
